Public Transit Isochrones with Valhalla
I keep getting questions about the state of isochrones in conjunction with transit routing in Valhalla. There’s been support for it for a couple of years now, and with Valhalla being able to read GTFS feeds directly, it’s really easy to set up yourself. So here’s really just a short recipe to get a GTFS feed into Valhalla and see some isochrone results.
 1# get some GTFS feeds, e.g. at https://www.sfmta.com/reports/gtfs-transit-data
 2# unzip it
 37z e muni.zip
 4
 5# create a directory that holds all feeds
 6mkdir feeds && mv muni feeds
 7
 8# get an OSM file that covers the whole extent of all feeds
 9wget http://download.geofabrik.de/north-america/us/california-latest.osm.pbf -O cal.pbf
10
11# maybe fit it a bit so the graph build doesn't take forever
12osmium extract -b -122.567596,37.675669,-122.332764,37.853170 --overwrite -o sf.pbf  cal.pbf
13
14# build timezones
15valhalla_build_timezones > tz.sqlite
16# create a valhalla config file
17valhalla_build_config --mjolnir-transit-feeds-dir=feeds --mjolnir-transit-dir=transit --mjolnir-tile-dir=sf \
18                      --mjolnir-tile-extract=sf.tar --mjolnir-timezone=tz.sqlite > valhalla.json
19
20# build transit
21valhalla_ingest_transit -c valhalla.json
22valhalla_convert_transit -c valhalla.json
23
24# build the graph
25valhalla_build_tiles -c valhalla.json sf.pbf
26
27# finally, make the tar
28valhalla_build_extract -c valhalla.json
29
30# and voila, run the service and fire requests
31valhalla_service valhalla.json
32
33curl -L 'localhost:8002/isochrone' \
34-H 'Content-Type: application/json' \
35-d '{
36        "costing": "multimodal",
37        "show_locations": false,
38        "contours": [
39                {
40                        "time": 25.0
41                }
42        ],
43        "polygons": true,
44        "id": 1,
45        "denoise": 0.0,
46        "generalize": 0.0,
47        "date_time": {
48                "type": 1,
49                "value": "2024-01-28T17:20"
50        },
51        "locations": [
52                {
53                        "lon": -122.475279,
54                        "lat": 37.721529
55                }
56        ],
57        "format": "geotiff"
58}' > out.geotiff
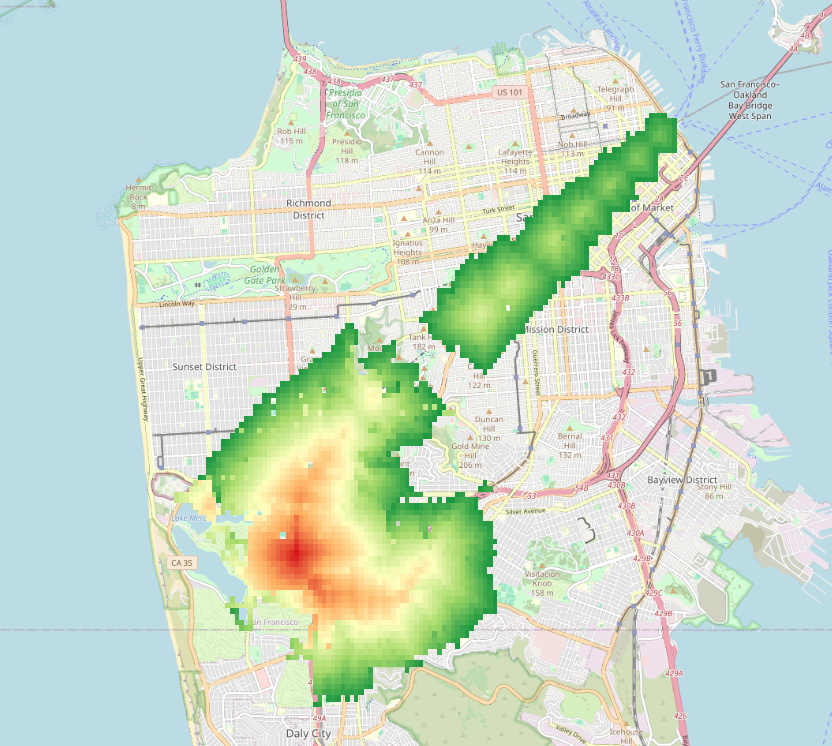
…and Bob’s your uncle. If you look at the geotiff file (you can e.g. simply pull it into QGIS, you have to apply a pseudo-color to the raster layer though), you should see a shape similar to the one in the image. If the shape of the raster data is more circular with no islands, that indicates that the transit building might not have worked properly and that the isochrone expansion simply resorted to walking.
This is a minimal working example of course. The geotiff format is optional and can be avoided by leaving out the "format" argument in the
request. In reality, you may want to have a base graph that you repeatedly add transit to every time you get updated feeds. This can be achieved by specifying -e build when building the graph. You can then resume the build once you have rebuilt your transit data by specifying -s enhance with valhalla_build_tiles.
This is a little list of instructions for those who want to work with their own Valhalla build; if this is too inconvenient for you, you can also use this docker image, which also allows for easy adding of transit data, just follow its docs.